
Wall Street rebounded Wednesday on China, AI, and QTR end rebalancing boost and is now hovering around a record high. At around 5300 (S&P 500) and TTM EPS 184.25, the current TTM PE of the S&P 500 is now around 28.76, substantially above the mean PE for the last 10 years around 20. Even if we consider projected CY23 EPS around 193.48 and 222.50, the projected PE would be around 27.40 and 23.80. The market may be now discounting projected CY25 EPS around 255.88; forward PE is now around 20.71. The average EPS growth of the S&P 500 is now around +17.50% (~18%) since 2018.
The market was expecting -100 bps Fed rate cuts in 2024 and 2025 each (from June 24) and QT tapering from June’24 to close the same by Dec’24. But going by the overall Fed/Powell/Waller statements, Q&A comments, trend of core inflation, and also the Nov’24 US Presidential Election, the Fed may go for -75 bps rate cuts in 2024 starting from September after closing the QT by Aug’24. Previously, the market was anticipating Fed rate cuts from June’24. The CME Fed swaps now price in only 75 basis points of easing in 2024 against earlier -150 bps a few months ago.
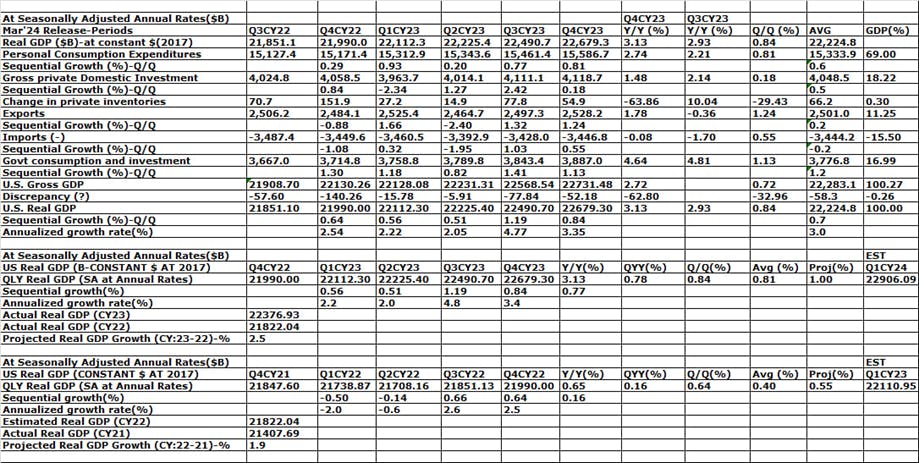
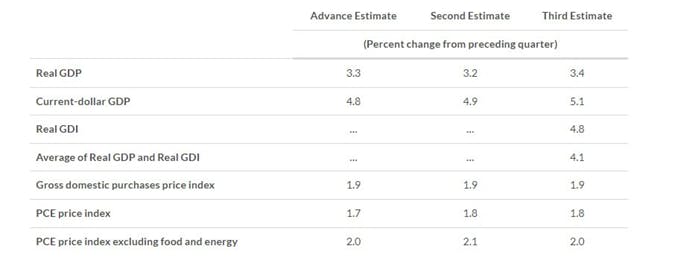
On Thursday some focus of the market was also on US GDP data. The BEA final estimate data shows U.S. real GDP for Q4CY23 was around $22679.30B against $22490.70B sequentially (+0.84%) and $21990.00B yearly (+3.13%); all in 2017 constant prices and at seasonally adjusted annual rates. In other words, the U.S. economy has expanded by around +0.84% sequentially (Q/Q), which is equivalent to +3.4% (~3.35%) annually (y/y). In the previous (2nd) estimate the U.S. Real GDP was around $22669.90B, at an annualized growth rate of +3.2%.
The US economy expanded an annualized 3.4% in Q4CY23, slightly above the 3.2% previously reported, led by higher consumer spending and non-residential business investments. Consumer spending was revised higher (3.3% vs 3% in the second estimate), led by services (3.4% vs 2.8%) while goods rose less (3% vs 3.2%). Also, non-residential investment was revised higher (3.7% vs 2.4%), due to intellectual property products (4.3% vs 3.3%, structures (10.9% vs 7.5%), and investment in equipment (-1.1% vs -1.7%). Residential investment continued to grow although slightly less than expected (2.8% vs 2.9%). Looking further, government spending rose way more (4.6% vs 4.2%) but both exports (5.1% vs 6.4%) and imports (2.2% vs 2.7%) increased less than initially reported. Meanwhile, the drag from private inventories was much bigger than in the second estimate (subtracted -0.47% from the growth vs -0.27%).
In the 1st estimate, the U.S. real GDP for Q4CY23 was around $22672.90B against the 2nd estimate of $22669.00B and $22679.30B in the 3rd and final estimate; i.e. there is a positive revision of around $10.30B, led by upward revisions to consumer spending and non-residential fixed investment that were partly offset by a downward revision to private inventory investment.
The 2nd estimate of real GDP was boosted by a positive revision of personal consumption expenditure (PCE-consumer spending), higher government consumption and investments, while dragged by a negative revision of private CAPEX/investment, and change in private inventories.
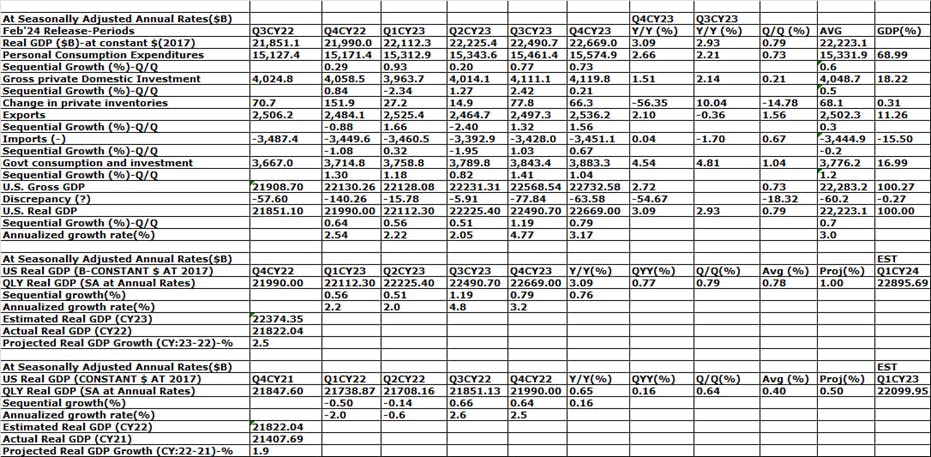
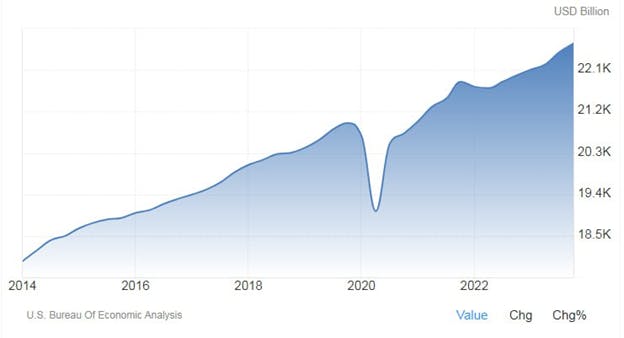
Considering the full 2023, the US economy grew 2.5%, compared to 1.9% in 2022. Overall, the U.S. real GDP for CY23 is now around $22376.93B vs $21822.04 in CY22 (+2.5%) and $21407.69B in CY21 (+1.9%); i.e. the U.S. real GDP grew +2.5% in CY23 against +1.9% in CY22, below Fed’s estimate of +2.6%. The U.S. real GDP is now growing around +0.8% average sequential rate (q/q); i.e. +3.2% yearly rate, above Fed’s +2.0% yearly (y/y) trend rate; i.e. +0.5% sequential (q/q) rate. On Thursday, the BEA final data showed current‑dollar (Nominal) GDP increased 5.1% at an annual rate, or $346.90B, in Q4 to a level of $27.96T, an upward revision of $12.4B from the previous 2nd estimate.
The U.S. real GDP for CY23 is now around $22.38T against nominal GDP of around $27.36T, which grew by around +6.3%. The U.S. real GDP got a boost of around $2T in 2023 after changing the base year from 2012 to 2017 constant prices.
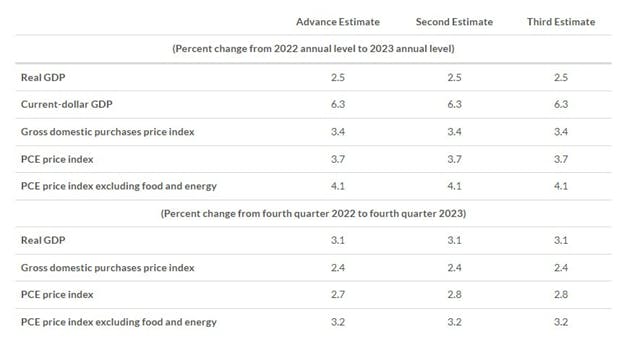
In Q4CY23, the price index for gross domestic purchases (GDP Deflator) increased by 1.9%, the same as in the previous 2nd estimate. The personal consumption expenditures (total PCE) price index increased +1.8% the same as the previous estimate, and the core PCE index (excluding food and energy) increased +2.0% from the prior estimate of +2.1%.
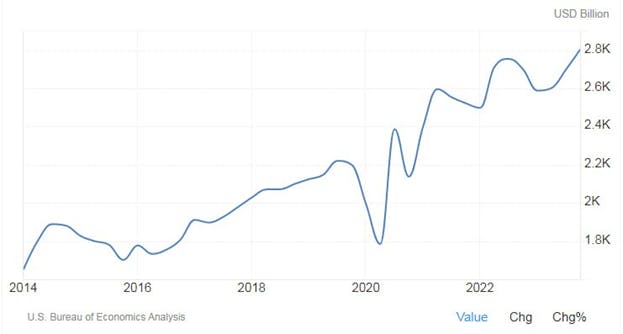
On Thursday, the BEA final data also shows US Corporate profits rose by +3.9% sequentially to $2.803T in Q4CY23, following a +3.7% increase in Q3. Net dividends rose by 1.3%, rebounding from a 1 percent fall in the previous period. Undistributed profits soared by 9.5% (vs 15.3% in Q3), and net cash flow with inventory valuation adjustment rose by 3.5% (vs 4.4%). Compared to the corresponding period of the previous year, corporate profits rose by 3.8% annually (y/y).
Overall on Thursday, Wall Street Futures, Gold briefly slid on hotter than expected US GDP revisions for Q4CY23 but soon rebounded on soft landing optimism and hopes of an early & deeper Fed rate cuts amid slightly lower core PCE price data. But such a small revision may not prompt the Fed to take any early rate cut action.
The 6M rolling average of US core inflation (PCE+CPI) is now around +3.6%. Fed may cut 75-100 bps in H2CY24 if the 6M rolling average of core inflation (PCE+CPI) indeed eased further to +3.0% by H1CY24.
As per Taylor’s rule, for the US:
Recommended policy repo rate (I) = A+B+(C-D)*(E-B)
=1.50+2.00+ (2.60-2.00)*(4.50.00-2.00) =1.00+2+ (0.60*2.50) = 3.00+1.50=4.50% (By Dec’24)
Here:
A=desired real interest rate=1.50; B= inflation target =2.00; C= Actual real GDP growth rate for CY23=2.6; D= Real GDP growth rate target/potential=2.00; E= average core CPI+PCE inflation for CY23=4.50
Fed may announce a plan for QT tapering/closing in the May meeting and should close the same before going for rate cuts in H2CY24. Fed, the world’s most important central bank may not continue QT (even at a reduced pace) and go for rate cuts at the same time as QT, and rate cuts are contradictory, although Fed/Powell kept the option open, at least theoretically.
Fed’s B/S size is now around $7.54T (as of 13th Mar’24), reduced from around $8.96T life time high scaled in Apr’22. Looking ahead, the Fed may maintain its B/S size around $7.00T, which would be 25% of the projected CY24 nominal US GDP of around $28T. Fed had indicated previously (before COVID) that B/S size is around 20% of nominal GDP. In Sep’2019, QT tapering (started in 2017) caused B/S size to fall to around $3.77T from around $4.47T, which caused severe disruption in the US money/funding market, forcing the Fed to go for small QE even before COVID.
Now Fed’s QT rate is $95B/M; i.e. $0.095T/M; if Fed intends to keep its B/S size around $7.00T from the existing $7.54T, it needs around 5-6 more months at the same rate of $0.095T/M; i.e. by Aug’24, Fed may be able to reduce its B/S size to around $7.00T and stop the QT. In that scenario, the Fed may go for -75 bps rate cuts in September, November, and December’24. By 18th September (Fed MPC date), the Fed will have complete data for core inflation and also unemployment/real GDP data till Aug/July’24 to have the required ‘higher confidence’ to go for rate cuts.
After the 2019 money/funding market crisis/disruptions caused by QT, the Fed introduced the ON RP/RRP lending facility (Overnight Repo and Reverse Repo Repurchase Agreement) to ensure financial stability even during QT periods, which generally causes less intention among big banks/MMFs (money market funds) to lend each other. Thus, this time QT was not disruptive like we saw in late 2019 causing some slide in Wall Street and making Trump furious against Fed/Powell.
Looking ahead, Fed may keep B/S size around $7.00T, at mid-2020 levels during COVID times to ensure financial/Wall Street stability along with Main Street stability (price stability and employment stability).
Ahead of the Nov’23 U.S. Presidential election, White House/Biden/Fed/Powell is more concerned about elevated inflation rather than the labor market; prices of essential goods & services are still significantly higher (around +20%) than pre-COVID levels, which is creating some incumbency wave (dissatisfaction) among general voters against Biden admin (Democrats).
Thus Fed is now giving more priority to price stability than employment (which is still hovering below the 4% red line) and is not ready to cut rates early as it may again cause higher inflation just ahead of the November election. Fed may hike only from Septenber’24, which will ensure no inflation spike just ahead of the Nov’24 election (as any rate action usually takes 6-12 months to transmit in the real economy), while boosting up both Wall Street and also Main Street (investors/traders/voters). Fed hiked rate last on 26th July’23 and may continue to be on hold till at least July’24; i.e. around 12 months for full transmission of its +5.25% cumulative rate hikes effect into the real economy.
Overall, the Fed’s mandate is to ensure price stability (2% core inflation), and maximum employment (below 4% unemployment rate) along with financial/Wall Street stability as well as lower borrowing costs for the government. As the US is now paying almost 15% of its tax revenue as interest on debt, the Fed will now not allow the 10Y US bond yield above 4.50-5.00% at any cost.

Bottom line:
Fed may not continue QT (even at a lower pace) and go for a rate cut cycle at the same time as these two policy actions are contradictory. Thus Fed may opt to first close the QT by Aug’24 at a B/S size of around $7.00T from the present $7.54T through the present pace of $0.095T/M. Then the Fed may go for rate cuts of -75 bps cumulatively in September, November, and December’24 for +4.75% repo rates from the present +5.50%. Fed is now using ON RR/RRP for funding market stability, especially for smaller/regional US banks (around 10% of the US banking system), there is no visible effect of QT unlike during late 2019. Thus Fed may opt for direct QT closing at the present pace by Aug’24, keeping the B/S size around $7.00T, almost 25% of the estimated nominal GDP ($30T) by 2024.
Market wrap:
On Thursday, Wall Street Futures closed almost flat amid QTR end portfolio rebalancing and hopes & hypes of an early Fed cut. But for Q1CY23, broader SPX-500 jumped +10.2%, the best Q1 gain since 2019, while export/China savvy blue chip DJ-30 gained +5.6% and tech-heavy NQ-100 surged +8.6% on AI and Fed pivot optimism. The market is now expecting deeper Fed rate cuts in 2025-26 as Trump is set to return to the White House. Fed may also end QT early by Aug’24 at a B/S size of around $7T. Gold is getting a boost from never-ending US deficits, debt and also dollar devaluation and elevated inflation; average headline CPI is still higher by over +20 from pre-COVID levels. Also, lingering geopolitical tensions over the Gaza and Ukraine war are supporting gold along with lower bond yields.
On Thursday, Wall Street was boosted by energy (higher oil), utilities, real estate, financials, materials, consumer staples, healthcare, and industrials, while dragged by communication services, consumer discretionary, and techs. Script-wise, Wall Street was dragged by Apple, Walmart, Amgen, Home Depot, P&G, luxury retailer RH (upbeat report card/guidance), Microsoft and Nike, while boosted by 3M, Walt Disney, Verizon, Intel, Chevron, Goldman Sachs, Boeing and Reddit (stake sale disclosure by CEO/COO) and Caterpillar.
Technical trading levels: DJ-30, NQ-100 Future, and Gold
Whatever may be the narrative, technically Dow Future (40145), now has to sustain over 40700 levels for any further rally to 42600 levels in the coming days; otherwise, sustaining below 40650-40450/40300 may again fall to 39250/38700-38200/37950 levels in the coming days.
Similarly, NQ-100 Future (18465) now has to sustain over 18850 levels for any rebound towards 19000/19200-19450/19775 and 20000/20200 in the coming days; otherwise, sustaining below 18800-18700, NQ-100 may gain or fall to around 18000/17500-17200/16875 in the coming days.
Also, technically Gold (XAU/USD: 2232) now has to sustain over 2205 for any further rally to 2225/2250-2275/2300; otherwise sustaining below 2200/2195-2190, may fall to 2175/2145*, and further to 2120/2110-2100/2080-2060/2039 and 2020/2010-2000-1995/1985-1975 and even 1940 may be on the card.
The materials contained on this document are not made by iFOREX but by an independent third party and should not in any way be construed, either explicitly or implicitly, directly or indirectly, as investment advice, recommendation or suggestion of an investment strategy with respect to a financial instrument, in any manner whatsoever. Any indication of past performance or simulated past performance included in this document is not a reliable indicator of future results. For the full disclaimer click here.
Join iFOREX to get an education package and start taking advantage of market opportunities.
 A beginner's e-book
 $5,000 practice demo account
 A 12-part video course