Listed on 
Listed on Years active

When you invest in share CFDs online, you will sooner or later run into the concept of ‘Quarterly earnings reports’. These reports are released periodically and offer plenty of valuable information for traders, especially those who follow fundamental analysis. The idea of ‘reports’ may sound a bit dreary, but many investors eagerly await to hear about company’s earnings, not to mention plenty of other useful data, and they could be used to make better, more informed, trading decisions. In this short article we will give you a quick insight into quarterly reports and their importance. Ready? Let’s get started.

Before we begin explaining why online traders follow quarterly earnings reports, let’s understand exactly what they are. Every public company has to report its performances every quarter. These are official filings that offer details on how the company did over the previous quarter. What information do quarterly reports include? Here are a few examples of the major components:
Keep an eye on earnings-per-share
It’s easy to disregard ‘earnings-per-share’, but this is actually one of the most important figures on a quarterly earnings report. Why? Because it provides a ratio of the company's earnings in comparison to the shares outstanding. Confused? In simple terms, it compares the company’s earnings to its market capitalization, and as such, it is viewed as a relatively reliable indicator of performance.
Quarterly reports are immensely important for online share traders – and share CFD traders. If analyzed correctly, these reports can help traders evaluate the financial strength and stability of a specific company and use this information when making trading decisions. An investor might analyze reports in order to decide if a certain company is worth investing in, or if he should hold – or sell – share CFDs.
For online traders though, these reports are not just important on their own, but also because they could be surrounded with market volatility. A report that falls short – or surpasses – expectations, can impact the share price and open exciting opportunities for alert traders.
Do all traders follow quarterly earnings reports? Of course not. There are many traders - and many trading strategies - out there. Fundamental analysts are likely to take quarterly reports seriously. Why? Because ratio and performance analysis is at the heart of decision-making.
Fundamental analysts tend to examine loads of information: Industry conditions, economic conditions, company management, its financial conditions and many others. They collect this information from the news, various economic indicators as well as from reports released by companies. The quarterly reports offer the kind of information fundamental analysts rely on and provide a relatively simple way of obtaining plenty of useful, reliable data in one serving.
Don’t be misled by the term ‘guidance’. Quarterly earnings guidance is not meant to offer investors actual guidance as to how they should trade, but rather show projections – what the company estimates will happen with its business, considering existing market conditions, spending and external influential factors. In essence, guidance is an estimate of future earnings, but it includes a lot of additional data. Usually, guidance includes estimates of revenue, earnings, margins and capital spending. Some companies also offer projections regarding cash flow, inventory and - in some cases - units sold.
While companies don’t have to release earnings guidance, they usually do. There’s no fixed date for the guidance, but it is common for companies to release it with quarterly earnings reports.
Guidance reports can be extremely influential – particularly the part dealing with future earnings. If there’s a difference between what analysts and investors expected and what the company expects, the share could be affected – for good or bad.

Remember to take guidance with a pinch of salt
At best, guidance is an estimation that was made dependent on existing market conditions. No one knows for a fact what the future holds and while guidance can be an important tool for online investors, it’s not actual fact – only an assessment.
As we mentioned earlier, quarterly earnings reports can have an impact on the market – before, during and after they are released. Here are some examples…
On January 31st 2017, Apple released an earnings report that managed to impress investors. The company posted record revenue – mainly thanks to holiday sales of the iPhone 7 – and ended three quarters of revenue decline. What happened to the share on the next trading day? Take a look…

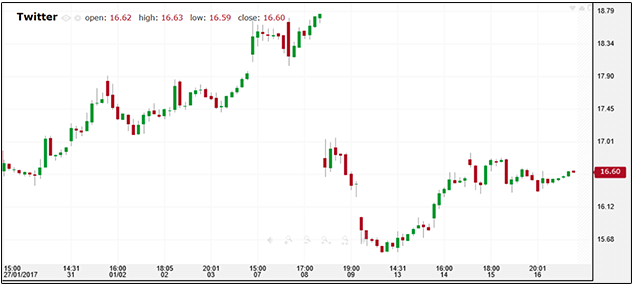
Would you like another example? We kind of thought you would. Well, just take a look at what happened to Twitter on February 9th 2017, right after it posted quarterly revenue that missed estimations. And – to top it off – the social network issued guidance that fell well below estimates. You don’t need to be a chart-expert to see the drop.
Do positive reports always result in a share increase and negative reports in a share decrease? We wish we could tell you it’s as simple as that, but the factors involved are a bit more complex. For starters, the difference between estimations and results matters. What do we mean? Well, let’s say that investors expected a specific company’s revenue to fall 10%, but it only fell 5%. This is still a drop – but not as bad as investors expected, so it can be viewed as a positive surprise. Similarly, if company’s sales or revenues increased – but not by as much as the market expected - this could be viewed as a disappointment.
Important:
Quarterly reports should always be viewed in comparison to market expectations.
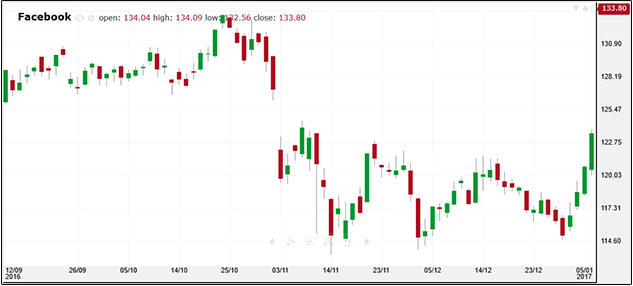
Even when a company has awesome results, it doesn’t mean that the share would necessarily move up. Want an example? Here you go…
On November 2nd, Facebook reported Q3 sales that increased 56%, well-exceeding estimations. The quarter also marked a fourth consecutive quarter of over 50% growth in revenue. Wow, that sounds amazing, right? Investors ought to be overjoyed… but they weren’t. As you can see in the chart below, the share fell. Why?
This example shows how important it is to look at the entire quarterly report and to follow the news articles surrounding it, rather than to pick a single detail. In this case, the important part of the report was a statement, made by one of the company’s executives, which said that this performance would likely not be replicated and that the rate of revenue growth will substantially decrease in 2017.
The market reacted, and as you can see, it wasn’t too happy about this forecast.
As we always try and stress: The market is made of people, and as such, it is composed of crowd psychology and subjective decision-making. People can look at the same quarterly report and draw different conclusions. They can look at the same report and choose to act differently. As an online trader, the quarterly reports can serve as a useful information resource. However, you and you alone, will need to decide how to interpret the results and decide how to act.
Join iFOREX to get an education package and start taking advantage of market opportunities.
 A beginner's e-book
 $5,000 practice demo account
 A 12-part video course
 Trusted partner
 Featured partner