Does history really repeat itself? According to many, if you study and analyze history, you’ll be better positioned to predict future political outcomes. Many theories used by online traders follow the same line of logic regarding financial markets. They believe that the best way to forecast an instrument’s price movement is to review that same instrument’s historical price movement. One of the ways to do that is via a system called the Moving Average Convergence Divergence (MACD), which is part of technical analysis.
Now, please, try and remember that this is just a theory, and past performance is not a reliable indicator of an instrument's future performance. We will tell you all about it, but it’s up to you to decide if you choose to use it or not.
Let’s begin…

Imagine for a minute that for the past twenty years, on every Monday, oil traded at an average price level of $51.00. Now imagine that every Tuesday, oil dropped down to an average price of $49.00. Although this type of consistent pattern can give investors a key insight into the upcoming price movement of oil, it may not be enough to trade the commodity CFD with a clear conscience.
That is because recent events should also be taken into consideration when opening a CFD position on the commodity. For example, if a key oil field in Northern Iraq falls victim to an armed conflict, this type of event could have a significant impact on the price of oil rendering historical price fluctuations largely irrelevant. That’s also why comparing historical price patterns to recent price patterns can give you a far better insight with regards to an instrument’s imminent price direction. That is the idea behind the MACD - where past meets present. Mind blown yet? Let’s continue…

The Moving Average Convergence Divergence (MACD) is what the city-slicker types refer to as a trend-tracking, momentum-oriented indicator. The purpose of this financial tool is to demonstrate the relationship between two moving averages. A moving average is a financial graph displaying a security’s past price behavior.
The MACD compares a specific instrument’s 26 day moving average with its 12 day moving average. Traders will often use the technical indicator to exploit the differences between short-term and long-term price patterns to try to better forecast impending price movements. To calculate the MACD, one must first subtract the instrument’s twenty-six day Exponential Moving Average (EMA) from the twelve day EMA.
After that subtraction is completed, the trader will then create a nine day moving average called a ‘signal line’ above the MACD on a chart. The signal line is the MACD trader’s catalyst for making buying and selling decisions. This means that when - and if - you use this indicator, the only line in the chart you need to be focusing on is really the signal line.
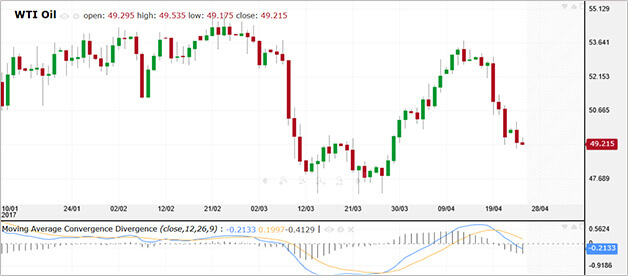
Remember: The two lines you see in the graph are NOT moving averages of the instrument’s price itself. Rather, they represent the DIFFERENCE between the two moving averages.
Although at first glance, the chart can appear to be intimidating, HAVE NO FEAR! In general - at least according to the theory - the actual trading decisions are pretty clear-cut as soon as the data is displayed and as long as you manage to follow the signal line.
It should also be noted that one of the more popular strategies involves locating crossovers.

The MACD is calculated by subtracting a security’s twenty-six day EMA (yay math!).
Remember: The EMA is a sort of moving average that resembles a simple moving average. The main difference is that with EMAs, more emphasis is placed on the latest data.
A quick reassurance
If you find all of this confusing, relax: Most of this data will be automatically calculated and served to you thanks to integrated technology that can automatically display the MACD indicator tool on most online trading platforms. Where can you find it? We’ll get to it in a bit. But first, let’s continue with the details…
MACD Histogram
The MACD Histogram is often displayed as a green bar graph that indicates the difference between the faster MACD line and a 9 day moving average also known as ‘the signal line’. This is the line/graph you really want to pay attention to. That’s because it’ll help better forecast future price movements. Calculating the signal line compels the trader to measure the difference between the two Exponential Moving Averages (EMAs).
Once that number is established, a nine-day moving average can be created. It should be noted that - due in large part to the combination of sophisticated charting software and advanced backward-testing capabilities – you can execute all calculations automatically. In other words, sit back, relax and let the robots do all the work.
This also means that savvy online traders almost never need to calculate the numbers on their own. However, they may be interested in understanding the formula used in the calculation. During crossovers, the Histogram will often disappear.

Divergence
When the CFD instrument’s price deviates from the MACD, it means that the current trend has ended. Don’t worry, when that happens, some traders switch to fundamental analysis to help better understand the reason behind the deviation.
Want to see what’s happening in the market today? Check out daily market analysis and gain insight into popular instruments.
Moving average crossover potential ‘Buy’ signal
According to the theory, a potential buy signal can be activated when the MACD (blue line) crosses above the zero line.

Moving average crossover potential ‘Sell’ signal
When the MACD crosses underneath the zero line, it can mean that a potential sell signal was generated.

A good way to use the MACD when trading is to utilize the strategy by locating buy-signals. That is precisely what happens when the MACD moves above the signal line, which is considered to be a bullish indicator.
This bullish sign will often compel the purchase of the underlying instrument. When the MACD crosses underneath the signal line, traders will often consider this to be a bearish signal. These types of signals will often compel the investor to sell. More advanced traders will often search for alternative indicators in the chart as well.
Confused? Here’s an example:
If the price of a security steers away from the MACD, the ‘divergence’ could spell the demise of the current trend. A drastic rise in convergence-divergence can also be of assistance.
Anytime the short term average skyrockets above the longer trend, it could indicate an overbought security. If that’s the case, the market can theoretically execute a correction and will often drag the price back down again.
Pay attention! Here’s the important part:
A positive MACD value comes about when the short-term average is on top of the longer-term average. This is utilized to indicate growing upward momentum. This value may also suggest that investors might want to hold back on opening short positions until a signal indicates a suitable point of entry. On the other hand, falling negative MACD values indicates that the downtrend is gaining strength, which could mean that the conditions to buy are less than ideal.
MACD False signals and timing
It should be noted that the MACD indicator could issue what’s known as a ‘false signal’. One example of this is if a bearish divergence exists on an hourly chart, with prices hitting new lows despite the fact that they are not in accordance with the indicator’s reading (which wouldn’t be showing a similar low). But hey, nobody's perfect.

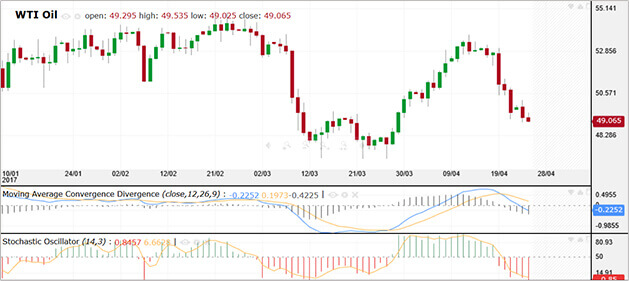
Like many other technical indicators, the MACD can be used alongside other indicators. One popular indicator that is often used with the MACD is the Stochastic Oscillator.
This duo complements each other rather nicely. Thant's because the Stochastic Oscillator will compare a security's closing price to its price range over a specific time span. Since the MACD is the composition of two moving averages diverging and converging with each other, combining it with the Stochastic Oscillator results is a great combination that can generate favorable results when exploited to its maximum potential. It’s a match made in heaven.
To view the full list of tradable CFD instruments available at iFOREX, visit our Trading Conditions page.

The same way the MACD complements other indicators, so too does it complement various trading strategies. Among those strategies are the Relative Vigor Index (RVI) and the Money Flow Index (MFI).
Combining the MACD with the Relative Vigor Index is rooted in the simple concept of matching crossovers. This means that if one of the indicators experiences a crossover, the investor will patiently wait for another crossover going the same direction as the other one. If this is the case, the investor will buy or sell the security and hold the position until the moving average is established. Both convergence and divergence provide the trader with a signal to close the position.

When combining the MACD with the Money Flow Index strategy, the investor will often combine the crossover of the MACD with overbought/oversold signals that are created by the money flow index (MFI). When the MFI provides us with a signal for an overbought security, the investors will often look for a bearish crossover of the MACD lines. If this is the case, the trader (assuming they follow the MACD theory), goes short. If it behaves in a similar fashion but in the opposite direction (an oversold MFI reading and a bullish cross of the MACD lines), the trader goes long.


Remember we told you that you can find the MACD indicator on the iFOREX platform?
Well, here is how you can access it:

So the next time you are looking to isolate price movement patterns when tracking a specific currency pair, share, commodity or index CFD, you may want to consider using the MACD. This popular indicator can give you a good understanding of the behavior of an underlying instrument’s past price movement. That’s because it combines recent performance with historical performance, giving you a rare financial insight into potential price movement.
Does this mean the MACD guarantees results? Of course not. Just like any other indicator, the MACD relies on theory, not facts, and it's up to you to decide if you want to use it - and to what extent.
Join iFOREX to get an education package and start taking advantage of market opportunities.
 A beginner's e-book
 $5,000 practice demo account
 A 12-part video course
 Trusted partner
 Featured partner