Listed on 
Listed on Years active
There are many theories that traders use while making trading decisions, and today we want to discuss a well-known one called ‘the Elliott Wave principle’. Don’t let the name mislead you. This is not an actual principle, only a theory, which forms part of technical analysis. It has interesting implications for investors who choose to accept it. In this short article we will explain how this theory works, the logic behind it and show how it can be used while trading online. Ready to get started? We’ll begin with the basics…

Why don’t we start with a bit of history? Just a bit, we promise. This theory, which was originally titled ‘principle’ was developed in the 1930s and 1940s by a guy named Ralph Nelson Elliott, who was a professional accountant. Elliott noticed that market prices fluctuate in patterns which he called ‘waves’. According to Elliott, humans follow rhythmical procedures, so calculations regarding future market activity can be projected into the future.
Essentially, the Elliott Wave Principle is used by finance traders to analyze market cycles and try to potentially forecast market trends. They do so by attempting to identify price highs and lows, crowd psychology limits and additional, related factors.

The Elliott Waves basics
The Elliott Wave principle is a bit complex, but if you follow the explanation carefully, we’re sure you’ll get the hang of it. Let’s begin with the basics and then dive a bit deeper.
According to the principle, investor psychology passes from optimism to pessimism and vice versa, in sequences. These upward and downward ‘mood swings’ can be seen as repetitive price movement patterns that are driven by the collective psychology. According to the theory, these patterns are expected to appear in every market or timescale.
This implies that the market operates in cycles. Elliott believed that if a trader successfully identifies these cycles, they could theoretically predict what the price will do next.
The price movement ‘patterns’ look like waves. What do these waves look like? We’re just getting to it…

According to Elliott, market prices constantly alternate between two phases: Impulsive and corrective. Let’s start with the former.
Impulses are featured in a set of five lower-degree waves. These lower-degree waves also alternate between impulsive and corrective. Essentially, the first, third and fifth waves are always impulses while the second and fourth are smaller retraces of the first and third waves.
Still with us? Let’s look at corrective waves.
Corrective waves are also divided – but into three smaller-degree waves. These include a five-wave counter-trend impulse, a retrace, and - last but not least - another impulse.
All this is true for a bull market, where prices typically move up. If we’re dealing with a bear market, where prices typically move down, this pattern is reversed.
Understanding the Waves
Okay, so now you must understand – at least a bit – what Elliott Waves look like, but it’s easier to understand this pattern if you have an insight of the theory behind each wave and what makes it move. Don’t worry, we’ll keep it short. Here’s the gist…
Wave 1
The instrument begins to rise. Why? In some cases because a relatively small number of investors feel – from various reasons that don’t have to be real – that the instrument price is ‘cheap’, and decide to buy it.

Wave 2
At this stage, some of the original buyers decide to ‘take profit’ and, when they sell, the instrument’s price decreases. This time though, it won’t get to its earlier low before it’s viewed as ‘cheap’ again.
Wave 3
Now more investors notice the instrument and decide to buy it, sending the price higher, usually higher than the peak of Wave 1. According to the theory, this is often the strongest and longest of the waves.
Wave 4
Again, some investors ‘take profits’ (although some are still buying). According to the theory, this wave is commonly weaker.
Wave 5
Now the instrument has caught a lot of attention and investors buy - big time - sending the instrument to ‘overpriced’ territory. Some investors will start ‘shorting’ the instrument, and the corrective phase – the ABC pattern – will appear.
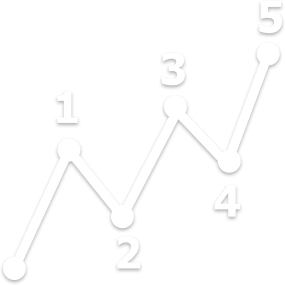
Need a visual explanation? Here’s an example of a 5-3 pattern.
The ‘impulse’ (also called the motive phase of the cycle, meaning it goes with the existing trend) is labeled with numbers 1-5.

Now let’s look at another example, but this time the ‘correction’ (also called corrective phase) is labeled with the letters A B C.

This is not where the model ends. In fact, the waves have waves within them - waves 1, 3 and 5 are impulses, waves 2 and 4 consist of only three waves. Here is - kind of - what it looks like…

Is this it? Far from it. When you go deeper into Elliott Wave analysis, you will discover that there are multiple types of motive and corrective waves, as well as exceptions that need to be considered. There are also calculations involved that require a bit more learning, but don’t worry about it now - this is as far as we go at this point, and you can always choose to do some additional reading once you cover the basics.
Just in case you found that last explanation confusing (we can’t blame you), here’s a quick summary of the essential points:
Want to see what’s happening in the market right now? Check out some live rates
We will not burden you with a long explanation on the relationship between Fibonacci and Elliott waves. If you’re interested, simply read more about it later on. All you need to know at this point is that after years of analyzing his ‘waves’, Elliott concluded that the Fibonacci series was the basis of the Wave principle. Fibonacci numbers appear again and again in Elliott wave structures - from motive waves (1, 3, 5) to the far more complex patterns. It’s interesting to note that Elliott had no idea that the Fibonacci sequence appeared in his model of the market and – in fact – claimed he had never even heard of the Fibonacci series when he originally developed his model.

Online traders who choose to use Elliott Waves while trading CFDs, need to familiarize themselves not just with various patterns and the wider analysis behind them, but also with the different types of ‘cycles’ that vary from the ‘Grand Supercycle’ (which lasts for several centuries) and ‘Supercycle’ (which lasts between 40 and 70 years to the much shorter ‘Minuette’ (lasting for hours) and ‘Subminuette’ (lasting for minutes).
Traders who follow this type of analysis usually start off by concluding that the main wave goes long and then they go short as the pattern runs its course and a possible reversal looms.
You might be thinking: “How can I know if I’m seeing an actual Elliott Wave pattern?” When in doubt, there are three main rules to consider:
First rule:
Wave 2 can never retrace more than 100% of wave 1.
Second rule:
Wave 3 can never be the shortest of the three impulse waves (which are, in case you’ve forgotten 1, 3 and 5).
Third rule:
Wave 4 will never overlap with wave 1 (in terms of price). The only exception to this rule is the very rare diagonal triangle formation.
In order to use Elliott Waves when trading forex in the form of CFDs you will first need to deepen your understanding of the waves and their different patterns. Why? Because the first stage in trading using Elliott Waves is identifying the waves.

For example, you will need to identify that a forex chart pattern is, in fact, a rising Wave 1, followed by a retracement - Wave 2. The next stage will be finding your entry point, and if you remember the rules we’ve listed above, you might find an entrance point that – according to this theory – will be right for you. You can also attempt to see if your chosen entrance point is a Fibonacci level. If you follow the rules above, you might remember that Wave 2 can never go lower than the start of Wave 1, and choose to place a stop loss accordingly.
This is all theory of course and depends on your ability to correctly identify the waves. How do you know if you’ve correctly identified the waves? Well, for example, if price level retraces more than 100% of Wave 1, then – according to the theory and rules we’ve listed - your wave count is incorrect.
As you can see from these last paragraphs, there are quite a few factors to consider. If you have no prior knowledge of Elliott Waves, it might be better if you use a demo account to train before you trade for real. You can also simply follow charts and test your ability to identify waves.
The Elliott Wave Principle is not a standalone theory that exists in a vacuum. As with many other trading strategies, investors often choose to use it alongside additional indicators as confirmation. This is also true for traders who use Elliott Waves, even more so considering that this theory is not always conclusive and has very differing time frames. Some people use CCI (90-day commodity channel index) or the relative strength index to try and assess the stage of the Elliott Wave pattern (determining, for example, if the pattern is valid or in which direction to trade).
When you dive into the math and analysis of Elliott Waves, you might be tempted to believe that this is a kind of science. Try and remember that in spite of all the calculations and charts, the Elliott Wave Principle is only a theory. While Elliott Wave analysis is widely accepted and commonly used among traders who engage in technical analysis, you will find plenty of people who reject the Elliott Wave Principle or draw different conclusions. Critics of this theory point out that it requires subjectivity and is therefore open to interpretations. There are even some people who question if Elliott Waves even exist.
As is always the case with market theories, we can only introduce you to the background and basic concepts. It’s up to you to decide if you would like to use this theory in practice - or not.
Certainly, though, you should be open to learning more about Elliott Wave theory, if only because of the many experienced traders who do believe in its power. It's a coherent and actionable theory with a sound basis in the historical price charts. According to its proponents, the fact that its application is ultimately left to subjective interepretation is not a drawback. Rather, as with other kinds of trading strategies, applying Elliott Wave theory gets more effective in proportion to the time and effort you put into it.
And, indeed, no trading strategy is able to set you up with a clear series of buy and sell signals for your instrument. Technical analysis tools like candlestick patterns, Bollinger bands, and MACD indicators are only designed to give you part of the price picture you're looking for. Ultimately, it will be left to you to connect the dots on your own and develop your own unique approach to the markets. A great place to grow as a trader is with the iFOREX team, where user empowerment is the top priority. Client support and education are two things on which iFOREX is unwilling to compromise.
Join iFOREX to get an education package and start taking advantage of market opportunities.
 A beginner's e-book
 $5,000 practice demo account
 A 12-part video course
 Trusted partner
 Featured partner