
Leonardo Pisano, nicknamed Fibonacci, was an Italian mathematician born in Pisa in the year 1170. His father worked at a trading post on the Mediterranean, and the young Leonardo traveled extensively in pursuit of his mathematics studies.
In his book, published in 1202, he helped popularize the Hindi-Arabic numerical system in Europe, and set forth a now famous numerical series which is named after him. In the Fibonacci sequence of numbers, each number is the sum of the two prior numbers: 0, 1, 1, 2, 3, 5, 8, 13, 21, 34, 55, 89, 144, 233, 377, 610 and so on extending to infinity. Each number is approximately 1.618 times greater than the preceding number.

This figure 1.618 is called Phi or the Golden Ratio and mysteriously appears frequently in the natural world, architecture, fine art and biology.
This ratio has been observed in Leonardo da Vinci's Mona Lisa, rose petals, shells, tree branches, human faces, ancient Greek vases, and even the spiral galaxies of outer space.
The Fibonacci numerical sequence has been translated into an investment strategy, allowing you to see the beauty of nature in financial charts.
Fibonacci levels provide objective price reference points and thus remove subjectivity (when used correctly), and make more informed decisions.
The Fibonacci retracement is a very popular tool used by many technical traders to help identify strategic places for transactions to be placed, target prices or stop losses.
According to this strategy, after a significant price movement up or down occurs, the new support and resistance levels can be found using a simple mathematical formula.
Fibonacci retracements in the context of trading, are not numbers in a sequence, but a representation of the mathematical relationships between numbers in it:
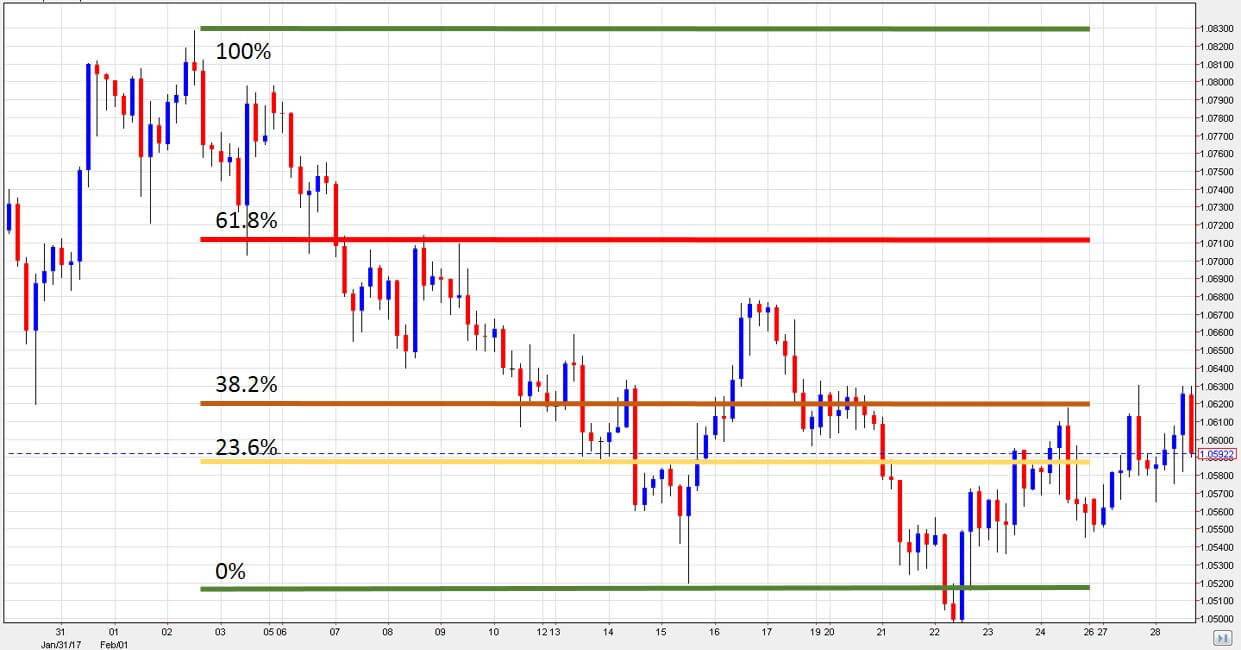

Fibonacci retracement levels can be used to forecast potential areas of support or resistance, at which time traders can enter the market trying to catch the initial trend when it resumes its course.
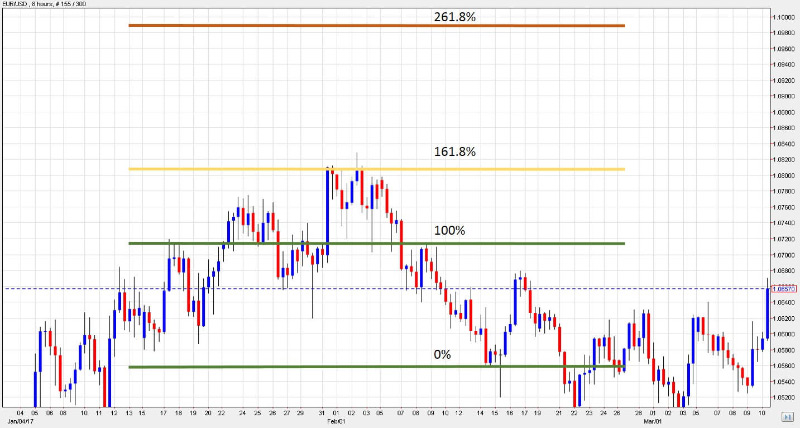
Fibonacci extensions can compliment this strategy by giving traders Fibonacci based profit targets.
Fibonacci extensions consist of levels drawn beyond the standard 100% level and can be used by traders to project areas that make good potential exits for their trades in the direction of the trend. The major Fibonacci extension levels are 161.8%, 261.8% and 423.6%.

While using Fibonacci levels are, in our view, extremely important, on their own they are not always reliable – just like any other form of technical analysis.
By combining Fibonacci with other technical tools, we can increase our chances of success.
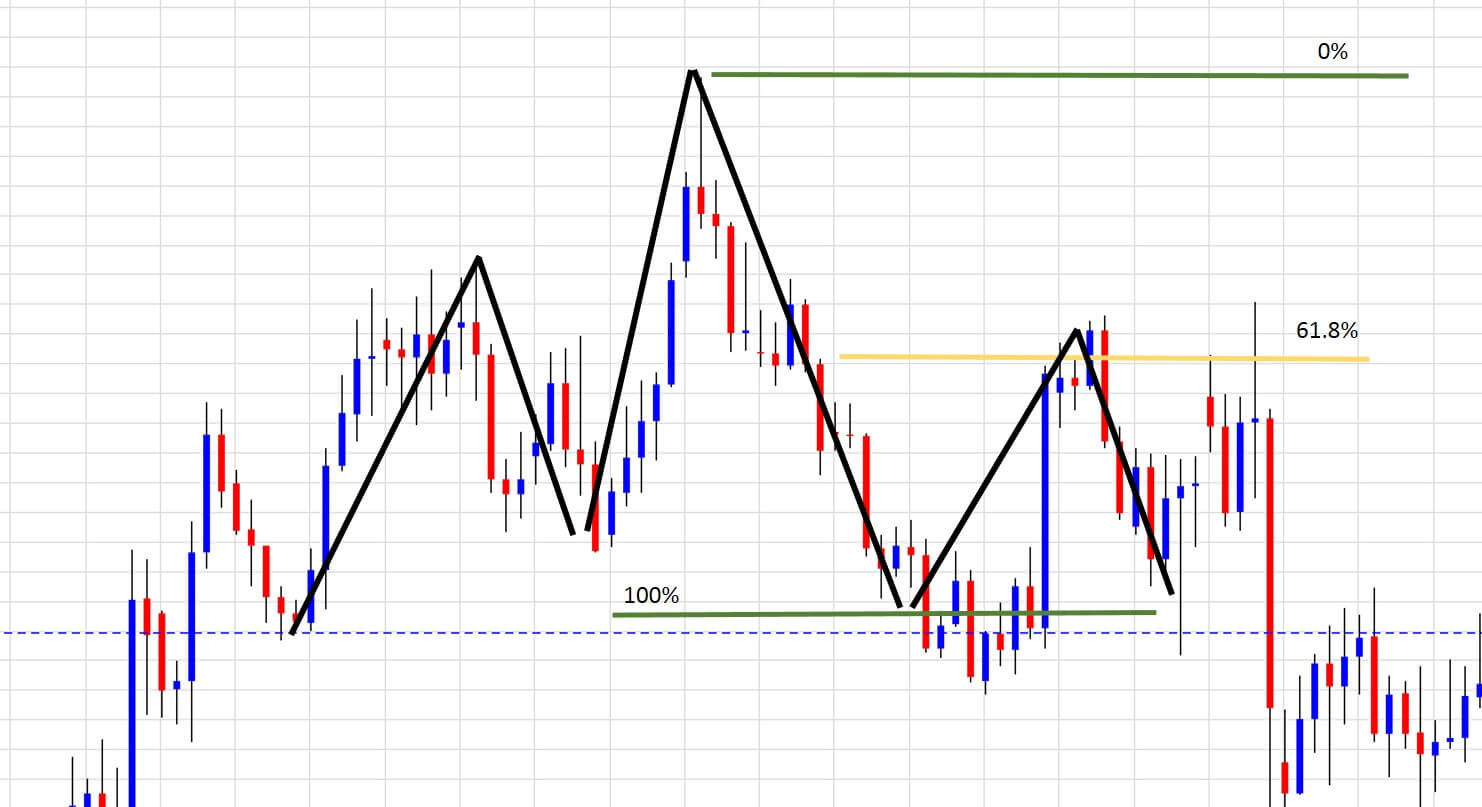
You can look for convergence of a Fibonacci level (especially the 61.8 or 78.6 per cent retracements, or the 161.8 or 261.8 extensions) with other support/resistance lines, trend lines, major highs/lows and the 50 or 200 day moving averages.
In Head and Shoulders, for example, which is a major reversal pattern, the right shoulder sometimes converges with the 61.8 or 78.6 Fibonacci retracement level, thus providing an ideal entry point.

There are common mistakes traders make when applying Fibonacci retracements to market charts:
After years of analyzing his ‘waves’, Elliott concluded that the Fibonacci series was the basis of his Wave principle. Fibonacci numbers appear again and again in Elliott wave structures - from motive waves (1, 3, 5) to the far more complex patterns. It’s interesting to note that Elliott had no idea that the Fibonacci sequence appeared in his model of the market and – in fact – claimed he had never even heard of the Fibonacci series when he originally developed his model.
Join iFOREX to get an education package and start taking advantage of market opportunities.
 A beginner's e-book
 $5,000 practice demo account
 A 12-part video course
 Trusted partner
 Featured partner