Listed on 
Listed on Years active

Today we’re going to look into a particularly interesting topic: The relative strength index, commonly known as RSI. You might be thinking that any term that includes the words ‘relative’ and ‘index’ can’t be all that fascinating, but that’s just because you haven’t gotten to know the abilities of the RSI or grasped its potential for online traders. This indicator is especially popular among technical analysis traders. What is it about and how is it used?
Let’s start at the beginning and then head a bit deeper.
Introduced by J. Welles Wilder in 1978, the Relative Strength Indicator is a technical indicator used to analyze various financial markets. It attempts to outline the historical and current strength - or weakness - of a specific share or market. How do you measure strength or weakness? The RSI does it by relying on the closing prices of a specific, recent trading period. What it really does is measure the momentum - the force and magnitude of price movements.
Essentially, RSI traders try and take advantage of trend direction to make decisions, attempting to predict what the price will do next.
The RSI’s main goal is to identify overbought or oversold conditions in a specific instrument or market.
A quick chat about Oscillators
The RSI is categorized as an oscillator indicator. Oscillators move over time within a band (either between predefined levels or above and below a center line). They’re commonly used to identify short-term overbought or oversold instruments.

Before we begin, let us reassure you: You will not need to actually calculate RSI, unless you really want to. The iFOREX platform is equipped with an RSI indicator tool, as well as many other indicators, and you can see the chart at the click of a button.
Okay, now let’s get down to business…

The RSI assesses momentum by comparing between higher closes and lower closes. For example, a share that had more – or stronger - positive changes will have a higher RSI than a share that had more - or stronger - negative changes.
The indicator is usually used on a 14-day timeframe, although longer or shorter periods can be used. RSI is featured on a scale of 0 to 100, where high levels are marked at 70 and low levels at 30. More extreme levels - 80 and 20 for example - indicate stronger momentum.
Are you ready to handle the actual formula? Here it is…
RSI = 100 - 100 / (1 + RS)
And now in English:
What’s RS?
Well, it’s:
Average gain of up periods during the time frame / Average loss of down periods during the time frame.
If you feel a bit dizzy, remember what we said earlier: You don’t need to actually calculate RSI on your own. Keep reading and you’ll find a simple explanation of using the automatic RSI tool on the iFOREX trading platform.
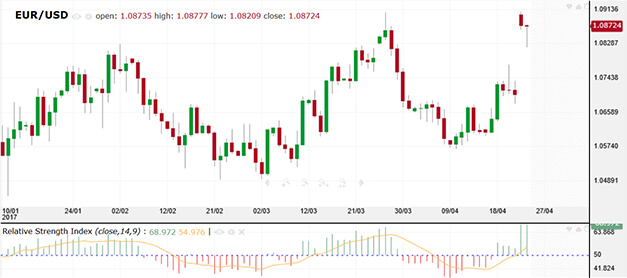
Want a visual example? Here is the RSI tool, applied to a currency pair we all know well – the EUR/USD.
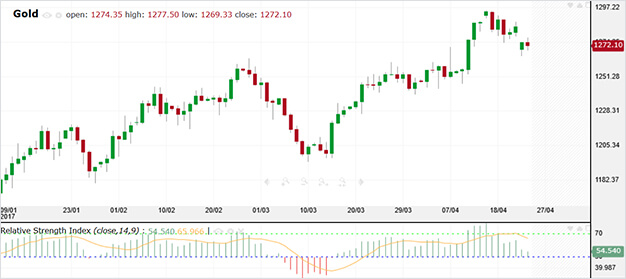
Want another example? Here is the same indicator applied to gold.

Now that we’ve covered the math (it wasn’t too bad, was it?), it’s time to try and interpret it. Traditionally, RSI values of 70 or higher indicate that an instrument is becoming overbought. An RSI value of 30 or lower indicates that an instrument is becoming oversold.
Either of these two options suggests that the instrument might be moving towards a trend reversal or a corrective price movement.
![]() What do all investors really want to know? Right - when to buy and when to sell. That’s the million dollar question. Well - in theory - the RSI offers signals, suggesting to investors when to buy (when an instrument is oversold) and when to sell (when the instrument is overbought).
What do all investors really want to know? Right - when to buy and when to sell. That’s the million dollar question. Well - in theory - the RSI offers signals, suggesting to investors when to buy (when an instrument is oversold) and when to sell (when the instrument is overbought).

We said that RSI can be used to potentially identify oversold and overbought instruments, but some technical analysts use RSI in more complex ways. Centerline crossover is one example. There are two types of these crossovers:
A rising centerline crossover
This crossover takes place when the RSI value moves above the 50 line and nearing the 70 line on the scale.
A falling centerline crossover
You can probably guess when this crossover takes place… that’s right - when the RSI value moves below the 50 line, nearing the 30 line.
Why do traders care about centerline crossovers? Because they can be used as market signals. A rising centerline crossover is seen as a bullish signal – but only until the RSI nears the 70 line (which - if you remember the theory - indicates overbought). A falling centerline crossover is seen as a bearish signal – as long as it’s not falling below the 30 line (which - in theory - indicates oversold).
Feel like we’re going too fast? Take a pause and revise technical analysis for beginners.


In theory, specific divergences between RSI and the instrument’s price movement offer a strong indication that a reversal is about to take place.
There are two types of divergence:
Bearish divergence (a ‘Sell’ signal)
Price reaches a new high but the RSI is at a lower high.
Bullish divergence (a ‘Buy’ signal)
Price reaches a new low but the RSI is at a higher low.

Let’s take a minute to discuss positive and negative reversals for RSI – which are exactly the opposite of bullish and bearish divergences. They are used as indicators, suggesting – according to theory - that the trend will continue.
Note that not all RSI traders agree about using these reversals, but you should at least know they exist.
This reversal appears when the instrument reaches a higher low and the RSI reaches a lower low. The so-called ‘lower low’ is not located in oversold territory, but tends to be between the 30 and 50 lines.
Following a positive reversal, the price will continue to increase.
This reversal appears when the instrument reaches a lower high and the RSI reaches a higher high. The so-called ‘higher high’ tends to be located between the 50 and 70 lines – not in overbought territory.
Following a negative reversal, the price will continue to decrease.
!
Remember: Essentially, positive and negative reversals appear when price outperforms momentum. Since these reversals only appear in specified trends, they can be used to confirm the existing trend.


If we gave you the impression that RSI was some flawless indicator, it really isn’t. In fact, there is no such thing in online trading, since each strategy and indicator has its own limitations.
Here are just a few of the limitations traders could encounter when using RSI:

!
Remember what we promised earlier? If you choose to use RSI while trading, you won’t need to make the calculations on your own and draw it on a chart.
There are two ways for you to access the RSI indicator on the iFOREX trading platform:
Note: You can choose to add more than one indicator to your chart in order to get an in-depth view of a specific instrument, but always remember to adapt your timeframes.

If you read the ‘RSI limitations’ section (and if you’ve skipped it, kindly scroll back and read it – it’s important), you should know that RSI is not some perfect indicator. This is why many investors choose to incorporate it into a wider trading strategy that includes additional, popular indicators such as the MACD - moving average convergence/divergence. Never heard of it? Well, MACD is used to find changes in the direction, duration, momentum and strength of an instrument trend and just like the RSI, it is also an oscillator. If you want to know more, simply check out our MACD page.

Stay up to date with recent market changes with our daily market analysis.
Among the useful technical tools offered on iFOREX's trading platform is the Relative Strength Indicator, which can give you a hint of the strength of a price trend in your asset. This is super helpful because it increases your chances of predicting the future direction of prices correctly, which is the bread and butter of any successful CFD deal. Using the RSI together with other technical indicators can go even further in attuning you effectively to the markets. But as in with any analysis tool, prudent risk managemet is advised.
Learning how to integrate the RSI into your trading strategy will come with time and experience, but also with the assistance of iFOREX's education center, which offers explanatory lessons in both written and video formats. Besides this, interacting with the broker's trading coach can go a long way in setting you on the right path. When you feel you're ready to go, first take a practice run with the free demo account available on the platform. And finally, when you want to speak to a real, live person, iFOREX's attentive staff are available for you through email, phone, or chat.
Join iFOREX to get an education package and start taking advantage of market opportunities.
 A beginner's e-book
 $5,000 practice demo account
 A 12-part video course
 Trusted partner
 Featured partner